
Real Estate Prices and Unreported Inflation
-
 by Richard Morrison
- January 13, 2021
- Trends
- 0
I bumped into a lady today while getting my daily dose of Starbucks $7 latte (tip included). Don’t worry, it was a light bump (and she started it). She recognized me despite looking like I was ready to go back to bed and asked if it was OK to ask me a few questions about the Vancouver real estate market.
I said, “sure, but my experience lately is that many people are interested only on what resonates with their social media feeds, their news channel, or a Google search that does not go beyond page 2.” I was having a tough morning.
I got an unimpressed look (undeservingly of course), so I mentioned “look if I could show you 2 graphs that could show you a long term trend, would it be helpful?”
She said, “no, but show me anyway.”
The problem is, if you don’t at least have an inkling about these historic changes you have absolutely no chance of understanding what’s been happening, and more importantly, what’s going to happen – until it hits you right between your eyes financially.
Before I blab on here is a quick summary for those in a hurry:
Quick Summary
Inflation is an important consideration in the Canadian real estate market, as it is an indicator of the rising cost of goods and services. This is of particular concern to those who are buying or selling property in the country. Nevertheless, some experts caution that connecting home prices with inflation may obscure the true sources of soaring prices. When the effects of inflation are taken into account, the reduction in national house values is more substantial. Homeowners often do not consider inflation when they evaluate changes in home prices. The Bank of Canada, on the other hand, looks at core inflation to identify the initial effects of changes in indirect taxes.
So what does historic change look like anyway?
There has been a lot in the last 40, 30, 20 years, heck even in the past 10 months.
Let’s look at the 2 charts: 1) one about a historical change just 10 months ago and 2) one that started in the 1980s (cue the 80s music and bring my fake mullet please).
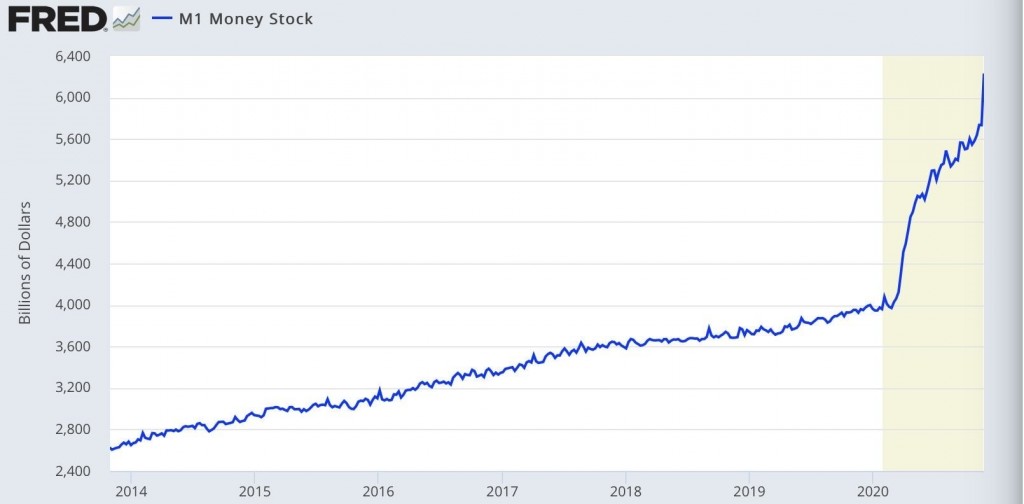
1) Chart 1 – Money Supply
For instance, how about the bat crazy fact that central banks have printed 35% of all US dollars in existence in the past 10 months:

If that 35% increase in money supply figure seems surreal and makes you question the very nature of reality and the universe, congratulations you and I are not so different after all. That with the fact that Elon Musk is an alien makes me think we’ve crossed over to a new parallel universe.
Our governments have now proven that money CAN grow on trees – or at least that THEY can grow it like its from a tree.
Do you see that on your social feed? Do you see it in the news? I mean that should be front page news.
What Headline do you write such a monstrosity of news?
“Extra Extra! Kids usually ask Santa for presents and grown ups get to pay for it on Christmas. But this year, grown ups get the presents while our kids will have to pay for it!”

In all seriousness, what does it mean when you print that much money? But more specifically, what does it mean for hard assets and real estate prices?
Well if we look for the guidance from Milton Friedman (you know the economist known for the 1976 Nobel Memorial Prize), he specifically mentions “inflation is primarily a monetary phenomena.“
By the way, I don’t mean to patronize anyone, especially given my lack of knowledge in economics – mainly because I don’t have any.
But what I do have is research from the past effervescent stars that have a proven track record – and I have implemented their principles for the last 20 years – which also helped with my track record.
So back to Milton Friedman. What does he means by – “inflation is primarily a monetary phenomena?”
In a nutshell. pertaining to real estate (and other hard assets): the more money you print, the more it will inflate hard assets – including real estate.
That’s basically it for real estate purposes. Simple.
Those of you who have been following along for the past 20 years know that I have been hitting the same note over and over. We have had unreported inflation for decades (read 40 years) and our governments have been printing money like mad for 40 years. This is one of the main reasons why prices have elongated so much.
But now we have the MOTHER LOAD of all money printing – in 10 months.
That’s HISTORICAL.
“But Richard inflation is at 2%, isn’t it?”
The Bank of Canada and Statistics Canada report an inflation rate of around 3-4%, however, some individuals are worried that the official statistics are not capturing the higher cost of living during the pandemic.
This could mean that the inflation rate is being underestimated. Inflation can have a damaging effect on purchasing power, and can also lead to wage and price inflation, scarcity, and profiteering. There is no definite proof of unreported inflation in Canada, but there are still worries about the accuracy of the official figures.
2) Historical Chart #2 Inflation is NOT 2% – it’s 8%.
Ah, I am glad you asked. And that brings me to chart number 2.
INFLATION STATS COMPARING THE BASKET PRE 1980 TO TODAY…TELLS ALL
As of November 12, Governments says we are at 2% or so…using a basket used pre 1980 we are actually closer to 8%!
The BLUE line is if they had kept the calculation as inflation was calculated in the 1980s (you know with items that actually impact our living costs). The RED line is the newly reformed calculations that exclude a lot of the things that represent our true cost of living.
In a nutshell, governments suppressed how inflation is calculated in 1980s. In fact, US and Canadian governments depressed reported inflation, moving the concept of the CPI away from being a measure of the cost of living needed to maintain a constant standard of living.
Here are some items that were excluded: The costs of fruits & vegetables, gasoline, fuel oil, natural gas, intercity transportation, and mortgage interest, as well as all indirect taxes (gst/pst) (you know, all the things we need to live).
Also they allowed for cheaper substitutes: Allowing substitution of lower-priced and lower-quality goods in the basket (i.e. more hamburger when steak prices rise) lowers the reported rate of inflation versus the fixed-basket measure.
I don’t know about you but I don’t think a burger is a substitute for a steak.
But our governments think so.
If you find yourself struggling to keep up with costs vs your salary levels – know you know why. The inflation is understated, while costs keep rising due to an increase in monetary supply.
You can read more about it on Shadow Stats website, but essentially what I am trying to say is that we live in one of the most unreported hyper-inflationary eras of all time.
Our ACTUAL inflation rate according the the way it used to be calculated has been hovering around 8% per annum ever since the year 2000.
From the Shadow Stats website “Consumer Price Index has been reconfigured since early-1980s so as to understate inflation versus common experience. Politicians forced significant underreporting of official inflation, so as to cut annual cost-of-living adjustments to Salaries, Social Security, Retirements Benefits, Private Income…. etc“
source: Shadow Stats
So according to our stats at flyawaycafe.com, the average home price in Vancouver top areas in 2000 was about $800,000. If you add 8% inflation rate each year until 2020, you get approximately what we have today.
It is HYPER inflation to go from $200,000 to 1.8 million in 20 years. Its not that we get hyper inflation, we have been in one. It is just a matter of the time frame…Look at the percentages increases below.
It is like the frog in boiling water…He doesn’t notice he is in it. Here is a chart – for fun:
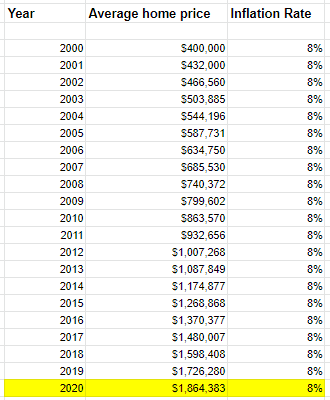
If you multiply 8% per annum from 2000 until 2020, you get precisely where the Vancouver real estate average price is today – approximately $1.8Million. And there are still those who believe we are in a bubble.
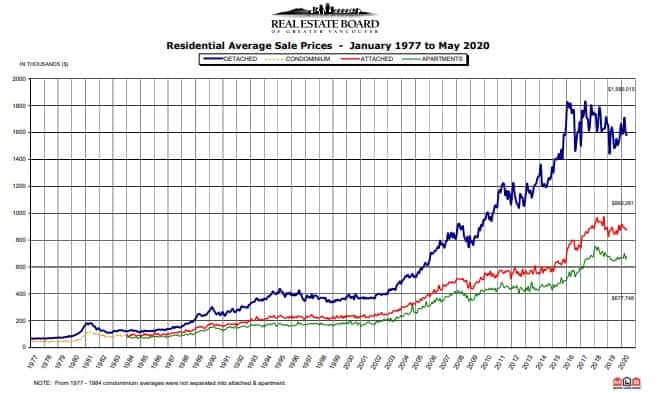
And if we look at a price graph of Vancouver we can see the inflation action right along the same lines!
Main Point: You must protect your money against inflation – its real and it will get stronger with this mother of all money printing. The world is uncertain right now. I don’t have a crystal ball for short term- what I do know in the past are the clear effects of the monetary printing phenomena that inflation has on real estate prices.
Now given what we know from the past inflationary periods, what do you think could happen to hard assets next (now that they have printed 35% of the worlds US dollars in the last 10 months)? I know where my money will be parked – in real estate.
Now let’s look at that money supply chart again – zoom in on that last part on the right to see the exponential uptick.
This it the time!
If would you like to develop a plan to put into ACTION for 2021, REPLY to this message and let’s have a chat!
Did you know that real estate prices in Vancouver have increased by 8% on average year after year due to unreported inflation?
I take full precautions for COVID 19.
If you have been waiting on the sidelines, its a good time to make a move! We certainly have been doing so ourselves. 👉 👉 Call me: 604-767-3703.
Cheers,
Richard Morrison 🙂
Can I help inspire you to achieve your real estate goals?
Making real estate work for you can be simpler than you may think. With a few strategies that I have developed over 20 years, you can get the results you want. I’ve summed up the research in a 17-page ebook. Put your email in the form and I’ll send it to you.
You’ll also receive updates on new articles, books and other things I’m working on. You can opt out at any time. See my privacy policy.
Sources:
https://www.bankofcanada.ca/2020/08/perceived-inflation-reality-understanding-the-difference/
https://www.shadowstats.com/inflation_calculator
Ready to turn your real estate dreams into reality? Contact Richard Morrison, Vancouver’s top realtor with 20+ years of experience. As a Medallion Club member and RE/MAX Hall of Fame award winning agent, he’s the expert you need on your side. Whether buying, selling, or investing, Richard’s personalized approach and deep market insights ensure a successful transaction. Reach out to Richard today at (778) 900-2235 and make your real estate journey seamless and rewarding.
Latest Vancouver Listings

Indian Arm freehold property in desirable Coldwell Beach at an attainable...

Gorgeous waterfront property on Eagle Island, West Vancouver with...

ATTENTION BUILDERS! 3365 Square foot level lot backing onto newly revamped...

Introducing a 2-bedroom suite that defines urban elegance. With an added...

Generously sized 2 bedroom and 2 bathroom apartment in the heart of Coal...
The Conservatory Luxury air-conditioned concrete large-size condo is the...

Autograph is a signature series of just 64 homes by renowned local...
Westside architectural excellence. The latest signature address behind the...

This breath taking 2 bedrooms + 2 bathrooms ocean view unit located in...

MODE presents this 565sf east facing 1 bedroom + flex home in River...

Welcome to the Legendary Woodwards W32. An immaculate and cozy 1 bedroom 1...
Welcome to the TELUS GARDENS - award-winning LEED gold architecture by...
Fabulous 2 bedroom, 2 baths + den, NE Corner suite at UPTOWN by Concord...

Lovely family home in this prime West Bay location. Gorgeous city and...
PENTHOUSE home in Wall Centre Central Park! STUNNING panorama views of the...

'The Arc' by Concord Pacific! The best 1 bedroom floorplan in the...

MODE presents this 1406sqft East facing 3bedroom+flex+3baths home in River...

A nicely updated unit with a spacious sized bedroom and 1 bath. The...

The Pinnacle, an Iconic building in the heart of Yaletown. This unit has...
South Vancouver simply affordable one-bedroom home features spacious...
Start your search with Richard Morrison, Top Award Winning Vancouver Realtor:
Contact Richard Morrison Top Vancouver Realtor today to find a Vancouver real estate and Vancouver condos for sale. This includes eastside residences and eastside apartment for sale. Also check out West Vancouver homes for sale or maybe an West Vancouver condos for sale. If you prefer North Shore, take a look at our listings in North Vancouver homes for sale and North Vancouver condos for sale.
Vancouver East Houses
| Collingwood Downtown East Fraser Fraserview Grandview Hastings Hastings Sunrise | Killarney Knight Main Mt Pleasant Renfrew Heights Renfrew South Van Victoria |
Vancouver West Houses
| Arbutus Cambie Dunbar Kerrisdale Kitsilano McKenzie Heights Marpole Oakridge | Point Grey Quilchena SW Marine Shaughnessy South Cambie South Granville University West End |
Vancouver East Apartments
| Champlain Heights Collingwood East Downtown Fraser Grandview Woodland Hastings Hastings Sunrise Killarney Knight Condos | Main Mount Pleasant VE Renfrew Heights Renfrew South Marine South Van Strathcona Victoria VE |